

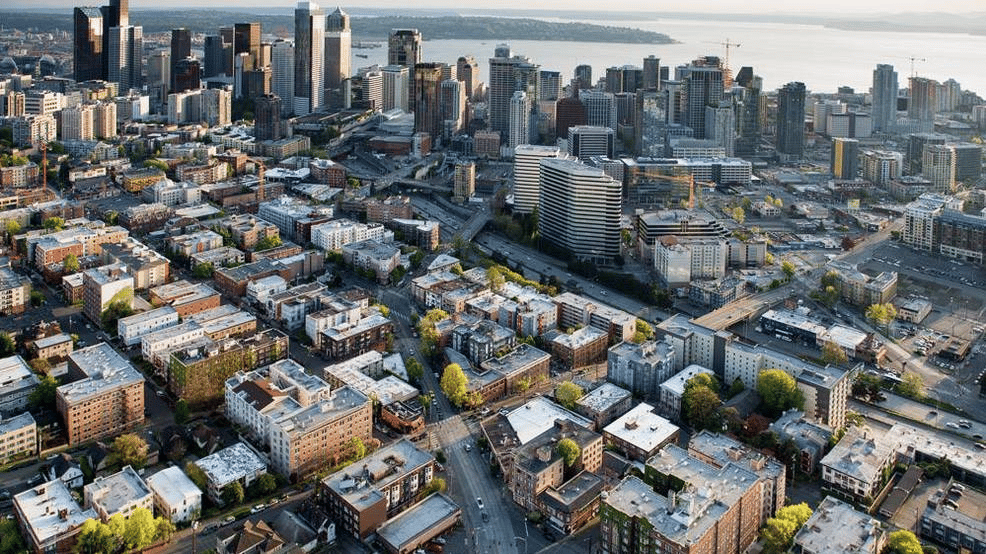
Seattle — Capitol Hill, Ballard, and Mount Baker have been found to be among Seattle’s hottest neighborhoods.
But we’re not talking just trendy or popular, a new study finds they are literally among the hottest spots in the city.
Earlier this summer, the group Geotab took thousands of hyper-local temperature readings across 20 large American cities to visually represent how they can feel warmer in certain spots due to a variety of factors.
In Seattle, as with the other cities, readings were taken at noon on June 21 — the longest day of the year — and show the city can vary as much as 8 degrees on a given cloudy, summer day, with a peak temperature reading of 70 degrees and a low of 62 degrees. For comparison, the city’s official reporting station, Sea-Tac Airport, reported 66 degrees at that time.
The 8-degree difference was the smallest of the 20 cities surveyed — Los Angeles had the greatest spread of 37 degrees (108 to 71) across its city while Phoenix was next at 30 degrees.
But Seattle’s research was conducted on a cloudy day after a marine layer had covered the city.

Thus, its effects may have been more pronounced on a sunny day.
Still, the map shows some hotter spots in some of the city’s denser areas: Downtown, SoDo, Ballard, Magnolia, and a large swath of South Seattle. Dense urban areas with concrete and asphalt will radiate heat more than grassy areas — noted by the cooler sections near some of the city’s larger parks.
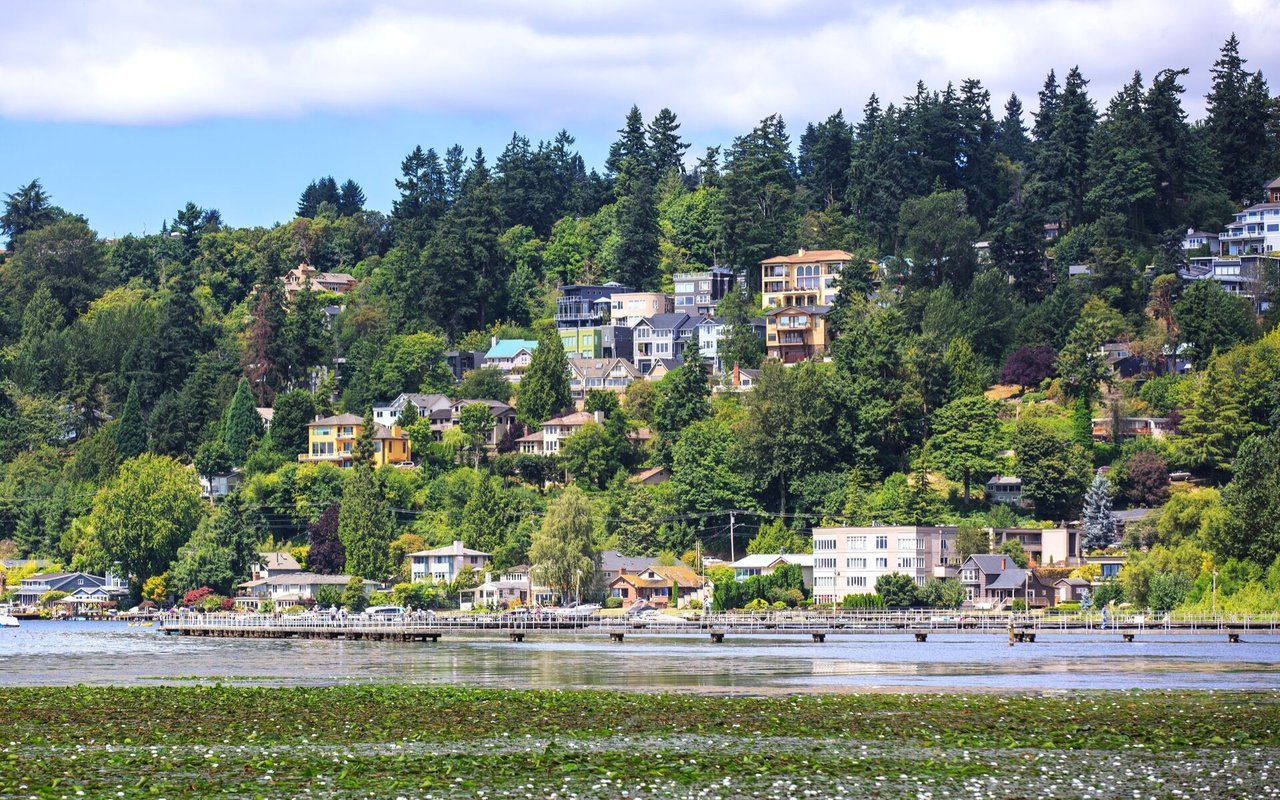
West Seattle can also claim to be among the cooler spots in the city with its perch right along Puget Sound; cooled by a bit of a southwest breeze that day.
But the point of the study was to highlight the temperature effects of urbanization. The temperature maps were created using an Inverse Distance Weighting algorithm from temperatures recorded from portable vehicle GPS tracking devices.
“As cities across the globe expand, having visibility into temperature patterns may become increasingly important for municipalities committed to creating energy-efficient urban environments and smarter cities,” said Mike Branch, Geotab’s VP of Data and Analytics. “By leveraging data such as hyper-local temperature data, cities are not only equipping themselves with the tools to make progressively informed decisions, but build safer and more sustainable communities for all.”
I’ve asked the company if they could do this study again sometime in the future on a sunnier day around the city to see if that shows a more dramatic difference in temperatures. If so, I’ll post an update in the blog!
Source: KomoNews.com

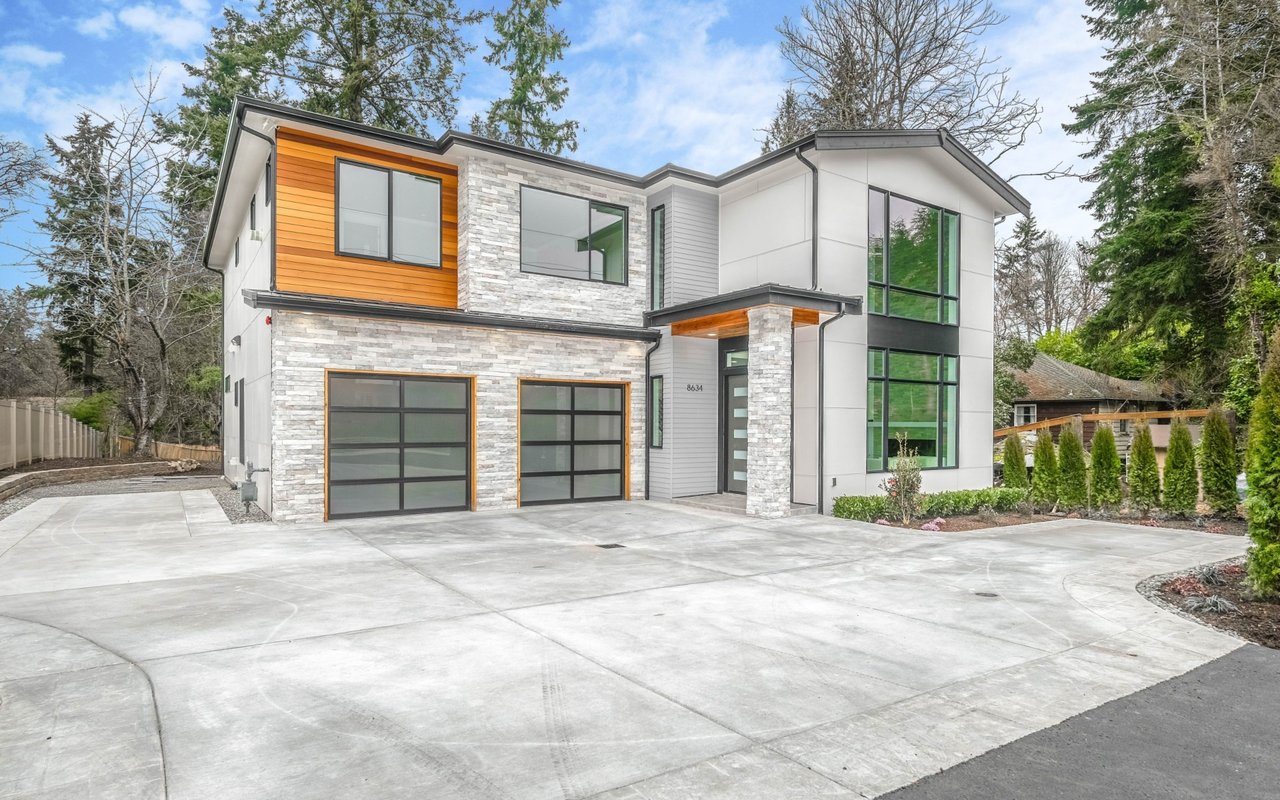
Get your home market-ready with painting, decluttering, clean windows, and more.
To help answer the first question as to why. Here are the data and facts.

I love helping my clients find the perfect home in the perfect neighborhood.
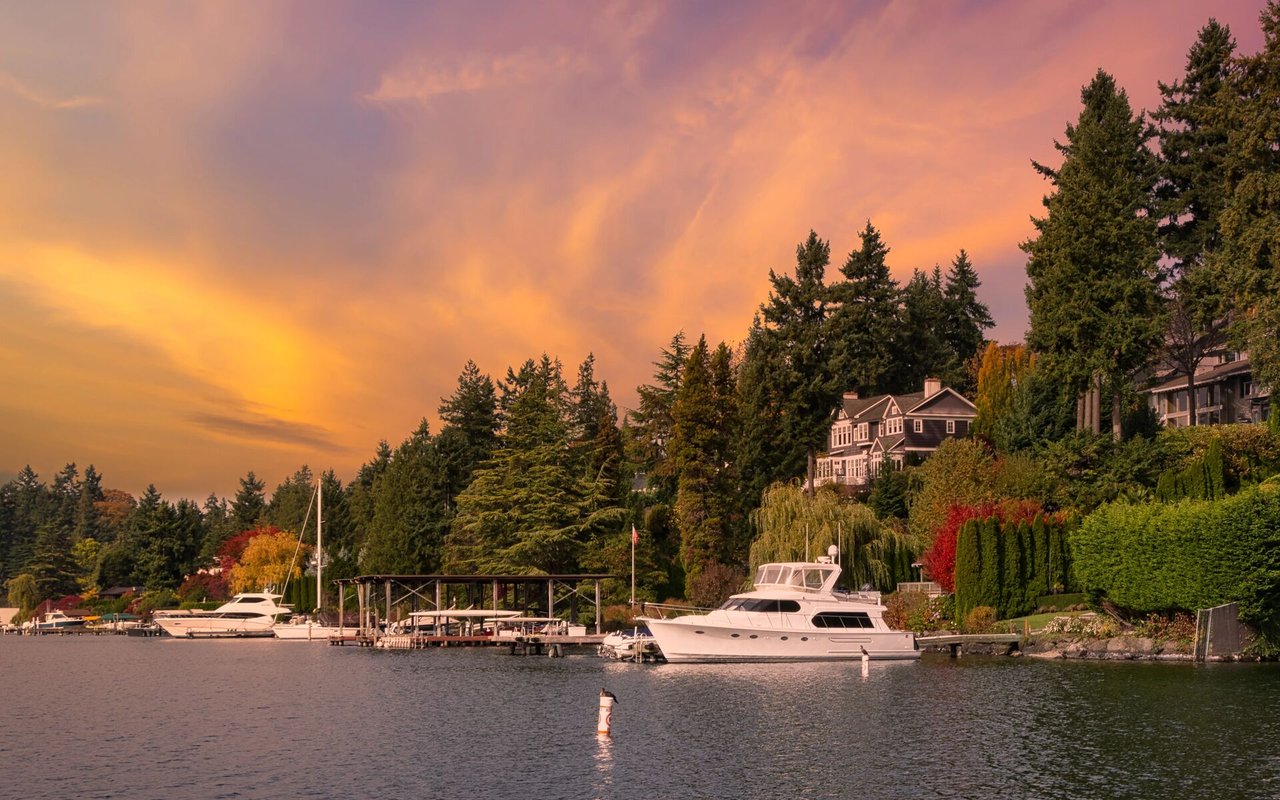
Meydenbauer Bay Park is Bellevue’s latest expanded 2-acre waterfront park.
Take a walk through Downtown Kirkland and discover favorite local spots and more.

“The Heart of Bellevue”, also known as Old Main Street is a collection of stores and shops.

Learn why home inspections are essential in homebuying.

Learn about Rob Macauley, a veteran mortgage professional.

Learn how to price your home strategically to attract more showings.
Whether you're buying or selling, I offer the market knowledge, resources, and support needed to help you make informed decisions. My goal is to simplify the process, anticipate challenges, and create a seamless experience tailored to your unique needs.

3933 LAKE WASHINGTON BLVD NE KIRKLAND, WA 98033