Getty Images/iStockPhoto
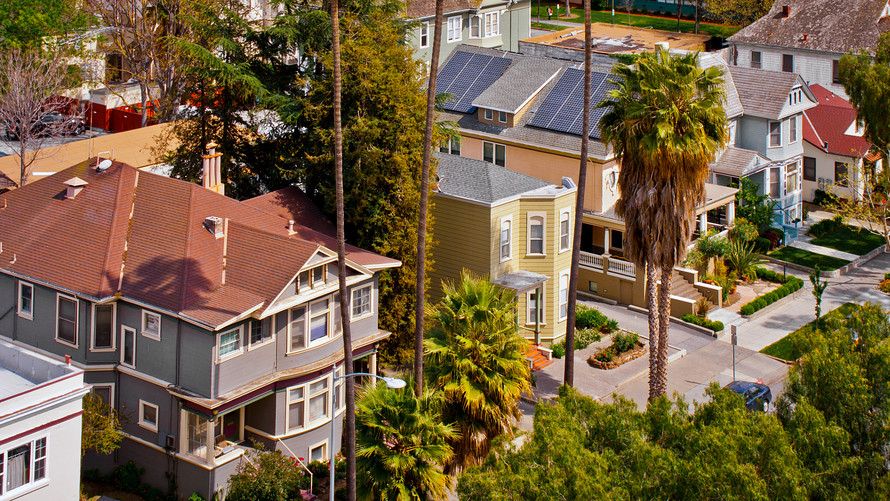
Cities like San Jose, Calif., are seeing more homes listed for sale this summer.
Home buyers in high-priced housing markets saw some relief in July, but it’s too early to tell whether that trend will continue.
The inventory of homes listed for sale increased year-over-year in 16 of the 45 largest metropolitan areas nationwide in July, according to a report released Wednesday by Realtor.com. They included markets that have experienced some of the most pronounced home price growth since the Great Recession, such as San Jose, Calif., and Seattle.
Metro area Annual change in active home listingsMedian listing price
San Jose, Calif. 44% $1,205,000
Seattle, Wash. 29% $569,000
Providence, R.I. 23% $350,000
Portland, Ore. 19% $472,000
San Diego, Calif. 18% $691,000
Dallas-Fort Worth, Texas 15% $349,000
Sacramento, Calif. 12% $460,000
Jacksonville, Fla. 11% $308,000
Riverside-San Bernardino, Calif. 10% $391,000
San Francisco-Oakland, Calif. 10% $940,000
New Orleans, La. 7% $282,000
Boston, Mass. 5% $519,000
Kansas City, Mo.-Kan. 4% $272,000
San Antonio, Texas 3% $292,000
New York, N.Y. 2% $536,000
Tampa, Fla. 1% $273,000
Los Angeles, Calif. -1% $752,000
Miami-Fort Lauderdale, Fla. -1% $394,000
Austin, Texas -1% $371,000
Detroit, Mich. -1% $253,000
Chicago, Ill. -2% $299,000
Raleigh, N.C. -3% $348,000
Houston, Texas -3% $323,000
Rochester, N.Y. -3% $188,000
Charlotte, N.C. -4% $340,000
Memphis, Tenn. -5% $211,000
Virginia Beach, Va. -6% $285,000
St. Louis, Mo. -7% $210,000
Baltimore, Md. -7% $325,000
Washington, D.C. -7% $448,000
Buffalo, N.Y. -7% $190,000
Atlanta, Ga. -8% $329,000
Cleveland, Ohio -8% $182,000
Louisville/Jefferson County, Ky.-Ind. -8% $251,000
Hartford, Conn. -9% $275,000
Pittsburgh, Pa. -9% $181,000
Orlando, Fla. -9% $316,000
Oklahoma City, Okla. -9% $239,000
Phoenix, Ariz. -9% $337,000
Richmond, Va. -10% $319,000
Cincinnati, Ohio -11% $257,000
Minneapolis-St. Paul, Minn .-11% $344,000
Philadelphia, Pa .-12% $270,000
Milwaukee, Wis. -16% $257,000
Indianapolis, Ind. -26% $272,000
(Realtor.com is operated by News Corp NWSA, +1.14% subsidiary Move Inc., and MarketWatch is a unit of Dow Jones, which is also a subsidiary of News Corp.)
Over the past few years, the number of homes listed for sale has shrunk considerably as more existing homeowners chose to stay put and homebuilding activity slowed to a crawl. Housing inventory continues to shrink, decreasing 4% year-over-year in July. Nevertheless, that’s slower than the 8% average rate of decline posted over the past year.
Higher costs of labor and materials and a low number of available lots have constrained homebuilding in recent years, said Danielle Hale, chief economist at Realtor.com. But in places like San Jose, where there’s greater demand for high-priced homes, builders are now finding more flexibility. “Builders can more easily pass on some of the increased costs they’re facing through high-end construction,” Hale said.
In other words, home builders will have to pay a higher price for things like lumber and construction workers regardless of the property they construct. Consequently, they’re more attracted to building trade-up homes or homes in pricier markets, since that will offset these added expenses, Hale said.
This helps explain why the inventory of homes listed above $350,000 increased 5.7% year-over-year, while the inventory of homes being sold for less than $200,000 has dropped 15.6%.
Builders are also sensitive to market sentiment. If buyers are indeed getting discouraged — whether because of the high home prices, rising mortgage-related costs or growing concerns about a potential recession — that could ultimately discourage new home building. And then many buyers may find themselves right back where they started, with fewer homes to choose from.
SOURCE: MarketWatch.com
+ show Comments
- Hide Comments
add a comment